GIS 3015 sp12 Mapblog
Tuesday, April 3, 2012
Bilateral Bar Graph
http://www1.eere.energy.gov/vehiclesandfuels/facts/2008_fotw546.html
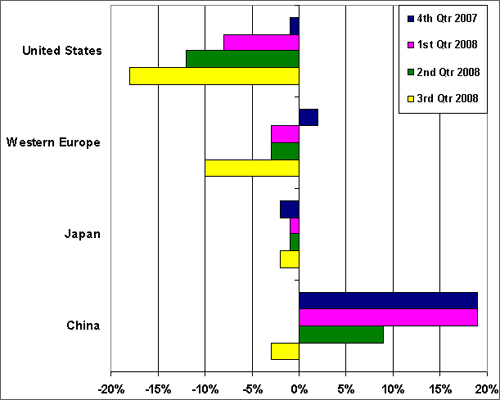
This Bilateral Bar Graph contrasts the global auto sales from 2007 to 2008. It has both positive and negative bars and a central axis of 0%.
No comments:
Post a Comment
Newer Post
Older Post
Home
Subscribe to:
Post Comments (Atom)
No comments:
Post a Comment