GIS 3015 sp12 Mapblog
Monday, April 2, 2012
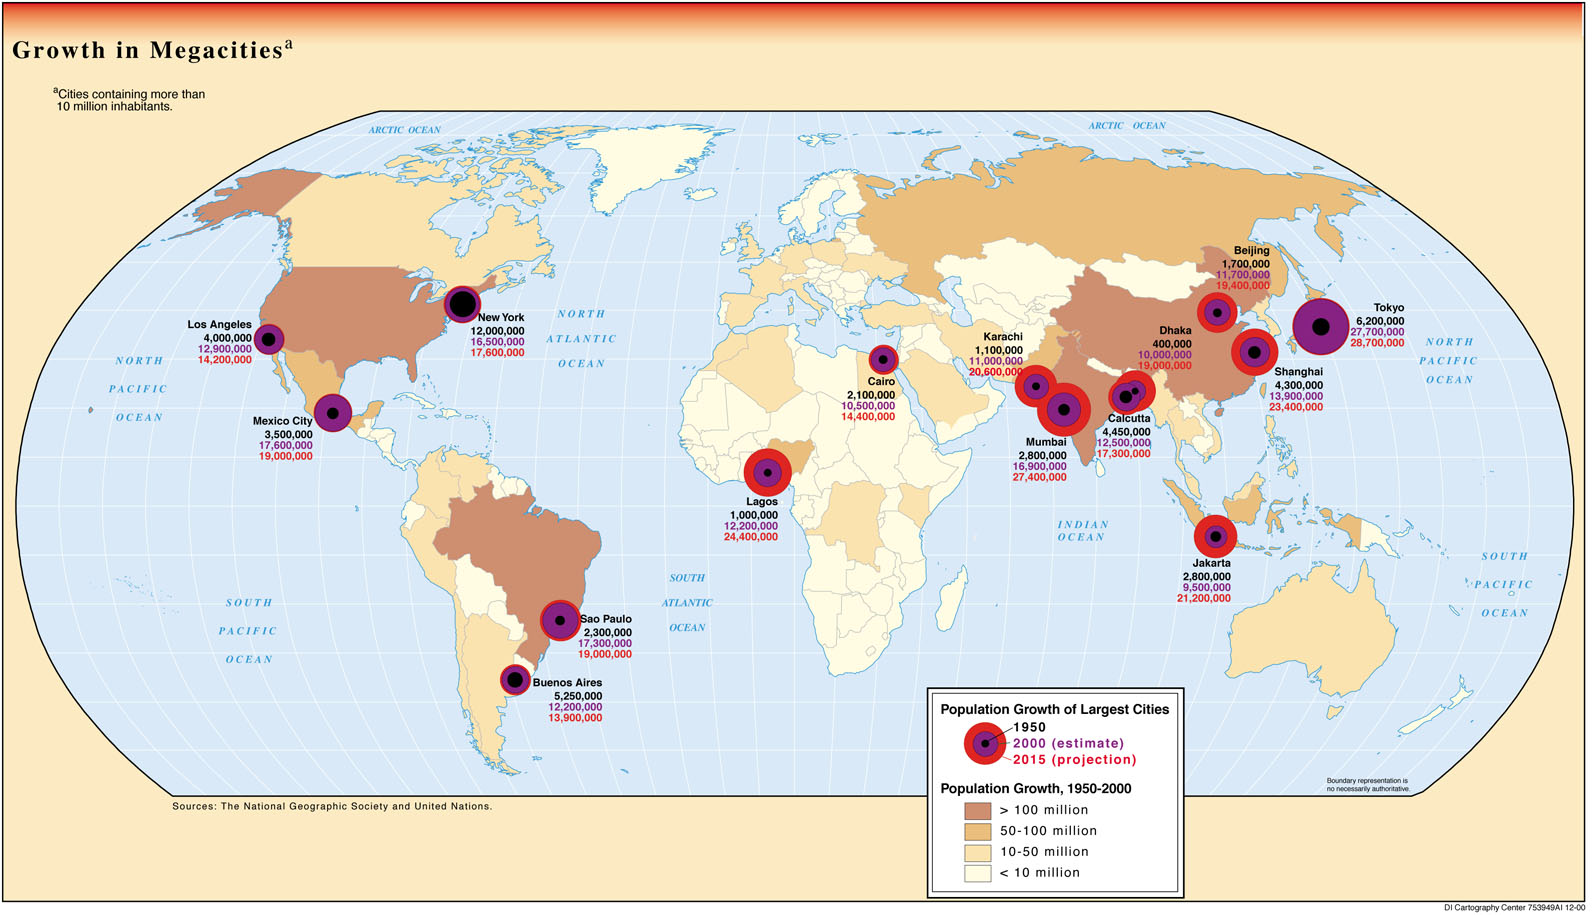
Statistical Map
http://www.skyscrapercity.com/showthread.php?t=1075987
This statistical map shows the variation in the growth in mega-cities all over the world. It uses circles to represent the stats.
No comments:
Post a Comment
Newer Post
Older Post
Home
Subscribe to:
Post Comments (Atom)
No comments:
Post a Comment